covid19india.org
March 2020
Volunteer-built COVID tracker that became India's de facto data source — 20 lakh daily visitors
During the early days of the pandemic, I joined a volunteer effort that became India's most trusted source for COVID-19 data. At our peak, we were serving over 20 lakh (2 million) daily visitors — many believed we were an official government source.
How It Started
In March 2020, as COVID-19 cases started appearing in India, a group of volunteers came together to track the data that the government wasn't publishing in an accessible format. What started as a simple Google Sheet grew into a full-fledged web application that became the primary reference for COVID data in the country.
My Contributions
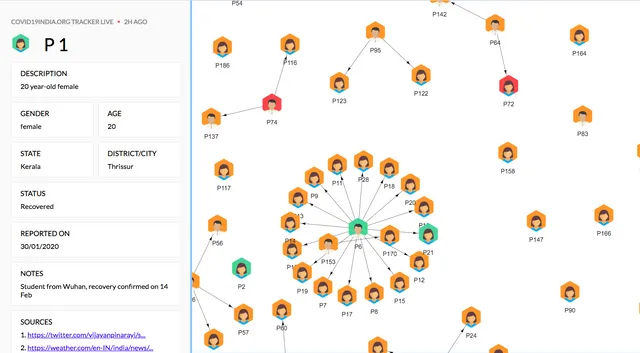
Cluster Visualization
I built an interactive network visualization showing how COVID-19 clusters spread across the country. Each node represented a case, with edges showing transmission links. This helped people understand the contact tracing efforts and how the virus was spreading through communities.
The visualization used D3.js force-directed graphs and could handle thousands of nodes while remaining interactive. You can see the source code on GitHub.
Data Pipeline & Caching
The backend was fascinatingly simple — we used Google Sheets as our database. Volunteers from hospitals across the country would update daily patient data in that spreadsheet — proper crowdsourced data collection at scale. The website would fetch the sheet data via the Google Sheets API.
I implemented frontend data caching with Cloudflare Workers wrapping the Google Sheets API. This was critical for handling our traffic — a 200k+ row spreadsheet serving millions of requests needed aggressive caching to stay responsive.
We also built data ingestion systems that coordinated 400+ volunteers across the country, ensuring data quality and consistency under the pressure of a rapidly evolving situation.
Impact
The site was cited by major news outlets and became the de facto source for COVID data in India before MoHFW had their own API and comprehensive dashboard. Journalists, researchers, and policy teams relied on our data.
The project was recognized with an Emergent Ventures COVID-19 Innovation Prize.
Lessons
This project taught me that the best technical solution isn't always the most sophisticated one. Our Google Sheets "backend" outperformed many traditional databases for our use case because it optimized for the right thing: enabling non-technical volunteers to contribute data without needing to know how to code.